
March Update, Including a Rainfall Chart
March Update, Including a Rainfall Chart

When it comes to climate change, the disconnect between what is written in peer-reviewed technical papers and what is reported on the nightly television news is almost as extreme as the recent 24-hour rainfall totals recently experienced where I live about half-way down the east coast of Australia. Just yesterday, Graham Young sent me a link to an Australian Bureau of Meteorology study by Jeff Callaghan and Scott Power published in the Australian Meteorological and Oceanographic Journal published (Vol. 64, 2014) that includes comment:
"Some of the most extreme events identified in this study occurred in the 19th century and the early-to-mid 20th century. This includes The Great Cyclone of 1954 and the Catherine Hill Gale in 1867. If these and other extreme events were to occur nowadays they would have catastrophic impacts, given the massive increase in population and infrastructure now present in those regions, and despite major improvements in warning and emergency services. For example, in the Gold Coast in 1954 there were just over 18 000 residents, whereas today there are approximately 500 000 residents, and the population of the adjacent Northern Rivers of NSW is over 250 000. The population of these two regions continues to grow rapidly. It is therefore crucial that the risk of such events is clearly reflected in planning. [end quote]
It is not reflected in the planning. After the 2017 flooding of Lismore, there were federal government grants offering ‘long term employment’ and ‘tree planting’ with the purported objective of reducing future flooding in Lismore by a ‘total of 10 centimetres.’ Absurd.
The February 2022 flooding exceeded the 2017 flood peak by more than 2 metres – perhaps exacerbated by the works undertaken with all the tax-payer funding for tree planting, not to mention the very levy built to prevent flooding overflowed and then acting as a barrier to the flood waters getting away.
Lismore is flooding again. There is disbelief that this could happen again in the same year.
Back in 1893 this region (southeast Queensland and the Northern Rivers) flooded from 1st to 4th February, then again on 18th February, then again on 10th and 11th June. And that was after terrible flooding early April 1892. There was terrible flooding again in 1898. That was a wet decade back in the 1890s.
If governments considered the historical record from the beginning, and were serious about flood mitigation, then the planning would at least consider dredging river mouths and building dams – and I would add better long-range weather forecasts. Instead, we are told to lament climate change and close-down coal mines.
Missing from the popular stories about recent ‘unprecedented’ rainfall along the east coast of Australia is any assessment of the actual rainfall data. The impression is that the volume of rain falling over any one 24-hour period has been increasing, along with the number of extremely wet days. But this narrative is not supported by the evidence – by the data.
When the torrential rains started here where I live in Noosa in mid-February, I started downloading daily rainfall values and initially thought we had some new records for places like Lowood in the upper Brisbane catchment. Except there are no records for Lowood for February 1893. It is likely that the rainfall gauge at Lowood was washed away back in February 1893! If we consider the rainfall record for Crohamhurst that is also in the Brisbane catchment, upstream of both the Wivenhoe and Somerset Dams, a truly staggering 2,046 mms fell between 31st January and 5thFebruary 1893.
The 24-hour record of 907 mms on 3rd February 1893 is the highest one-day rainfall total for anywhere in Australia. We will never know if this record was equalled or beaten in February 2022 because the Bureau has closed the Crohamhurst weather station. It was closed in March 2003.
The Bureau has a habit of closing inconvenient stations. It closed the Charlotte Pass weather station which holds the record of −23.0 °C for the lowest daily minimum temperature in Australia, set on 29 June 1994. That weather station was closed in March 2015. Meanwhile, in June 2017, the Bureau opened several new stations in very hot western New South Wales. One of these stations, Borrona Downs, had a hardware fault and in August 2017 was spuriously recording temperatures as low as –62.5 °C. At the same time, in the cold Australian alps a limit of –10.4 °C had been set on how cold temperatures could be recorded.
The idea of such a limit on cold days does sound conspiratorial and it was reluctantly acknowledged in an official report from the Bureau – but only after I alerted Josh Frydenberg, then the minister responsible for the Bureau, to the problem at the Thredbo and Goulburn stations in July 2017. I could go on. The Bureau deleted what was long regarded as the hottest day ever recorded in Australia – Bourke’s 51.7°C on the 3 January, 1909 recorded at an official recording station in a near-new Stevenson screen with a mercury thermometer. It was scratched from the record in 1997 and replaced with the lower 50.7 °C recorded at Oodnadatta, South Australia, on 2nd January 1960.
Then there is the industrial-scale remodelling of the historical record. Just this month I’ve updated the interactive table at my website that shows the extent of the remodelling of the temperature record by plotting the annual maxima and minima series from each of the 112 homogenised ACORN-SAT sites (versions 1, 2.0, 2.1 and most recently 2.2) with the actual maxima and minima values from the Australian Data Archive for Meteorology (ADAM). There are 224 charts in total showing all the temperature series – raw and also homogenised.
This was a big job, and it is the only place on the internet that you will find this information. The Bureau never shows the remodelled (homogenised) values side-by-side with the historical. Click across and have a play.
As a worked example, I’ve just this morning posted something explaining the various iterations of the historical temperature record for Darwin. I’ve been trying to finish that blog post for more than a week, but it was just getting longer. I couldn’t stop reading the war history of that city/Darwin that was bombed so many times. I grew-up on a farm just to the south of Darwin and the ruins of the famous airfield at Coomalie Creek was on our farm. Anyway, I’ve posted a summary of the 3,400 words that I have written, with just a few snippets of war history. The rest will be included in the book I am putting together explaining how to fix Australia's temperature record that will include more war history.
Back to Lismore.
Earlier in the month I suggested to Chris Gillham (waclimate.net) that we see if the number of extremely wet days or their frequency was increasing for locations along the east coast of Australia that had recently experience severe flooding. Using daily data, we looked at the 10%, and for some 1%, of wettest days. I wrote this up as a blog post focused on Lismore. Then Sam McClelland – perhaps best known for organising Jordan Peterson’s tour of Australia back in 2007 – emailed asking if he could visit and film me talking about the data. He wanted me to explain how neither the number of very wet days nor the volume of rain was increasing based on the data.
In the little film that he has made, I also talked about the link between an atmosphere high in aerosols and more rain, specifically asking the question could the eruption of the Tongan volcano (Hunga Tonga Hunga Ha’apai) have something to do with the very high – but not unprecedented 24-hour total during February.
I explain how volcanic aerosols can supercharge the atmosphere, acting as condensation nuclei. There is an important chapter in ‘Climate Change: The Facts 2020’ entitled ‘Cosmoclimatology’ by Henrik Svensmark that explains the link between an atmosphere high in aerosols and wetter climates over the millennia.
In the video that Sam made, I talk about the year 1816 that is known as the year without a summer because of incessant rain in England from the explosion of Mount Tambura in Indonesia the previous April. The raining apparently continued for three years.
I realize that none of what I write accords with the dominant paradigm and that a presentation replete with rainfall charts, making reference to volcanic eruptions more than two centuries, ago is not particularly fashionable.
I suspect Jordan Peterson would call me disagreeable. Ever since I watched that interview he did on Channel 4 (the one with over 37 million views), I’ve felt less inclined to apologize for my tendency to be more concerned with getting to the facts of the matter than with pleasing.
To be both controversial, and disagreeable, I will venture to add that I am still trying to work out whether the war in the Ukraine is about the elites wanting regime change in Russia – or something else. Having followed journalist Miranda Devine for years, and her obsession with Joe Biden’s son Hunter and his misdeeds in the Ukraine, I can only puzzle as to why the West was leading Ukraine down the ‘primrose path’ surely knowing the result was that the Ukraine was going to get ‘wrecked’. I am quoting John Mearsheimer a geopolitical scholar who forecast this terrible invasion some years ago.
I was going to mention the coral bleaching – but it is perhaps best that I wait until my ‘April Update’, and I have had an opportunity to visit John Brewer reef that has been described in The Guardian as at the epicentre of widespread and severe coral bleaching. Plans are in place for me to dive there in a couple of weeks and hopefully document the state of the corals with underwater video. I’m hoping long transects can be filmed by one of the best underwater videographers in Australia.
I’ve been assured by local dive operators that under the water it is possible to find some bleaching, but that there is also a lot of healthy coral. I’ve made recent comment at my blog about my past expeditions in search of coral bleaching.
The expedition to John Brewer will be with Dr Peter Ridd and as with all my recent research, it will be funded by the Institute of Public Affairs.
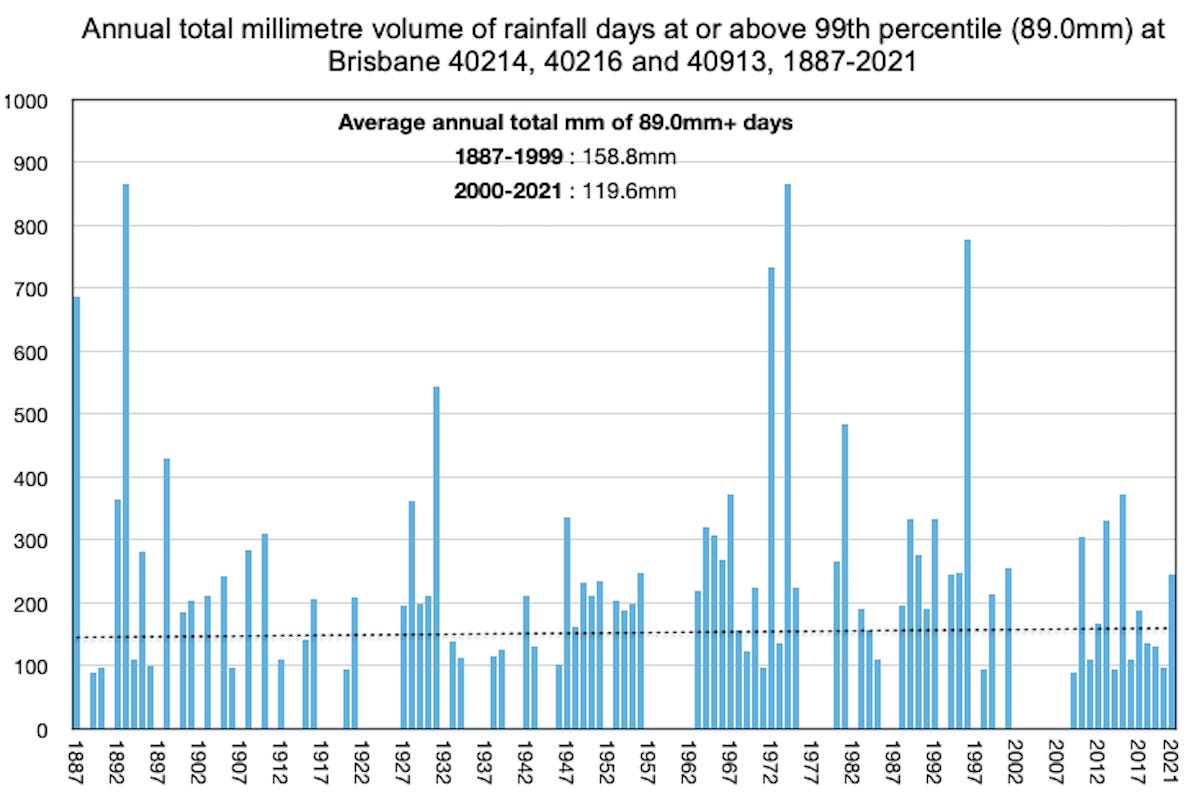
This chart shows the total volume of rain falling on the wettest 1% of days in Brisbane (measured as 99th percentile) for each year from 1887 to 2021. As for everywhere else, there has been no increase in the frequency of these extremely wet days, or the volume of rain falling. This contradicts the media headlines that come without any data – without evidence. You can find more information about this chart, and everything else by clicking across to my blog.
Just filing the content of an email just received here:
"Hi Jennifer, Love your work, look forward to your emails. CC 2020 the facts a great read.
Found this, thought interesting.
Solar power is less polluting than fossil fuels; but manufacturing processes emit greenhouse gases. Nitrogen trifluoride and sulfur hexafluoride have been tracked back to the manufacture of solar panels. Since these are potent greenhouse gases, they have thousands of times the impact on global warming as compared to carbon dioxide.
Bald Hills Wind Farm ordered to stop emitting night-time noise, pay neighbours damages in landmark ruling.
A concern of mine is 1.3B have NO access to electricity. If not coal, I don’t think renewables will cut it. Thinking nuclear!
Rod