

The Hydrological Cycle: Why Warmth Fuels Snowfall
Counterpoint #8. Every Monday for the Curious, a Counterpoint

The hydrological cycle is sometimes counterintuitive: warmer air, not colder, often leads to more snowfall.
Here’s how it works. Air’s capacity to hold water vapour increases exponentially with temperature—about 7% more per 1°C of warming, per the Clausius-Clapeyron relation.
In the equatorial Pacific, where sea surface temperatures (SSTs) are around 28–30°C, warm ocean waters drive evaporation, loading the atmosphere with moisture. During events like the 2021–2023 triple-dip La Niña, cooler central Pacific SSTs enhance convection in the western Pacific, lifting this moist air into the troposphere.
This warm, moisture-laden air doesn’t stay put. Atmospheric teleconnections, like the Pacific-South American pattern, channel it poleward via Rossby waves. The Ferrel Cell, a mid-latitude circulation, shifts southward during La Niña, amplifying this transport.
When this air reaches Antarctica, often via narrow “atmospheric rivers,” it encounters subzero polar air (e.g., -20°C). The warm air—sometimes 5–10°C above average—rises, cools adiabatically (at ~6.5°C/km for moist air), and condenses its abundant water vapour into clouds. In Antarctica’s freezing environment, this precipitates as snow, piling up on stable ice sheets like those in Wilkes Land.
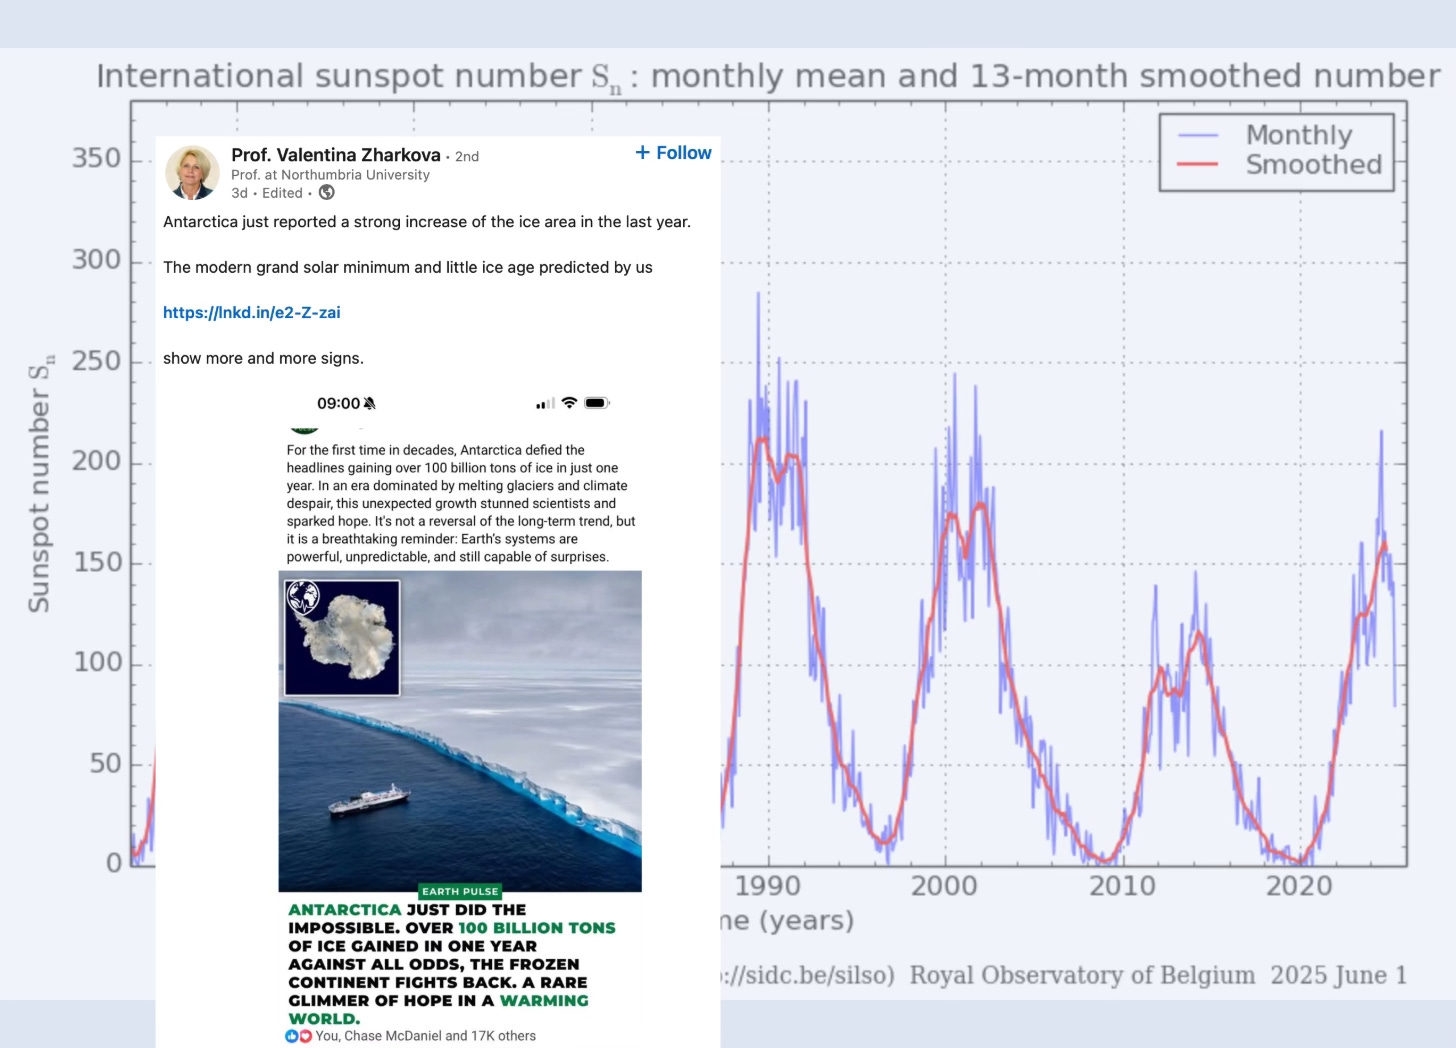
This mechanism explains the 2021–2023 Antarctic ice mass gain, where snowfall added 108–119 billion tons of ice annually. Far from indicating cooling, this snowfall reflects a warming world, where higher SSTs boost atmospheric moisture, fuelling extreme precipitation. This reflects a 60 year trend, not human-caused global warming.
Enter Valentina Zharkova, a solar physicist who has capitalised on this misunderstanding to promote her very global cooling theory. Zharkova argues that the 2021–2023 Antarctic ice gain, alongside earlier sea ice peaks like 2014’s, proves global cooling driven by a weakening sun.
Her claims resonate with those seemingly ignorant of the hydrological cycle and how climate works, as heavy snow intuitively feels like a “cold” signal.
By tying Antarctic ice to her solar forecasts, she suggests her predictions are reliable, gaining traction on platforms like X and LinkedIn, where her posts hype her work as evidence against human-caused global warming.
It is the case that human-caused global warming is a failed paradigm, but that doesn’t make Zharkova right. She misleads.
Zharkova’s narrative hinges on ignorance of how warm air drives snowfall. She overlooks the tropical-Pacific teleconnections that fuelled the 2021–2023 snowfall, misattributing it to a cooling planet. This allows her to frame temporary ice gains as validation of her broader theory, which predicts a Grand Solar Minimum—a period of low solar activity—starting around 2020, supposedly triggering a “mini ice age.” Her followers point to Antarctic snowfall as proof, ignoring the long-term net ice loss (150 billion tons/year from 2002–2023) driven by ocean warming and greenhouse gases.
Zharkova’s theory centres on a double dynamo model of the Sun’s magnetic field. Using Principal Component Analysis on 35 years of data (cycles 21–23, 1976–2008), she identified two magnetic waves—one near the Sun’s surface, one deeper in the convection zone—that she claims govern sunspot activity. In her 2015 Scientific Reports paper, she predicted these waves would increasingly cancel each other out, reducing sunspot numbers in Solar Cycle 25 (2020–2031) compared to Cycle 24, culminating in a Grand Solar Minimum by 2031–2042. This, she argued, would lower solar irradiance, cooling Earth and boosting ice growth, like Antarctica’s 2021–2023 gain.
But Solar Cycle 25 has defied her predictions. Cycle 24 peaked at a smoothed sunspot number (SSN) of 116 in 2014, the weakest in a century. Zharkova forecasted an even weaker Cycle 25, but data shows the opposite: Cycle 25’s SSN hit 144 by April 2024, with daily counts reaching 299 in August 2024. It produced over 1,000 M-class flares in 4.5 years, surpassing Cycle 24’s 11-year total, and 63 X-class flares (vs. 23 in Cycle 24), including an X9.0 flare in October 2024. Geomagnetic storms, like G4 events in 2024, further confirm Cycle 25’s vigor, aligning with higher-end forecasts (e.g., McIntosh et al.’s 210–260 SSN) rather than Zharkova’s decline.
You can read more about Antarctica as a store of coolth, that is Plank #2 of my new Theory of Climate Resilience. The Sun as Earth’s primary energy source and very constant is Plank #5 of my new Theory of Climate Resilience, and I am not forecasting global cooling anytime soon.
Star of Constancy: 99% Sun, 100% Life

In a world fixated on CO2 fluctuations, the Sun’s constant presence as Earth’s primary energy source is often overlooked. It is fundamental to climate resilience.
Antarctica as Earth’s Store of Coolth

Antarctica holds 60-70% of Earth’s freshwater; freshwater hoarded at the South Pole and also frozen! It is a store of what I’m calling coolth. The physical mechanism is the latent heat of fusion, where melting ice absorbs heat from the surrounding ocean and atmosphere without raising its own temperature.
#ClimateResilienceTheory #AntarticaAsCoolth #StarOfConstancy
I am still not clear in my mind as to the time scale or scales of Antarctic land ice accumulation and calving.
Exceptionally hot moist air radiates exceptional heat to outer space as it passes over the South Pole. But that exceptional cooling factor doesn't immediately cool the general atmosphere. Instead, it is stored as a weight of snow or ice that only with a delay presses down on the land ice. It takes time to squeeze out the ice to the edge of the land and into the sea, to melt and eventually cool the oceans.
One thought is that this ocean cooling might be continuous, so that this year's snow might trigger this year's ocean cooling, and we would have a negative feedback stabilising ocean temperatures on a one-year time scale. This would be slower than the tropical storm atmospheric circulatory convection temperature negative feedback stabilisation mechanism, that works on a time scale of hours or days.
Another thought is that this ocean cooling might take thousands or tens of thousands of years to proceed. What would trigger the calving on that time scale? Is this a dynamical factor in the hundred-thousand-year glaciation—deglaciation cycle of the current ice age?
Perhaps there are several time scales at work here?
Ned Nikolov says the drop in cloud albedo over the last few decades does not correspond to a change in cosmic ray ionisation promoted by Henrick Svensmark. We don’t know why cloud albedo has decreased.